Occasional high webhook latency with no corresponding call log entry

Description
I’m doing some webhook latency analysis and seeing frequent outlier differences between the event_ts values and our own webhook logs. Also puzzling is that I am unable to find these outlier requests in the Zoom app’s webhook call logs.

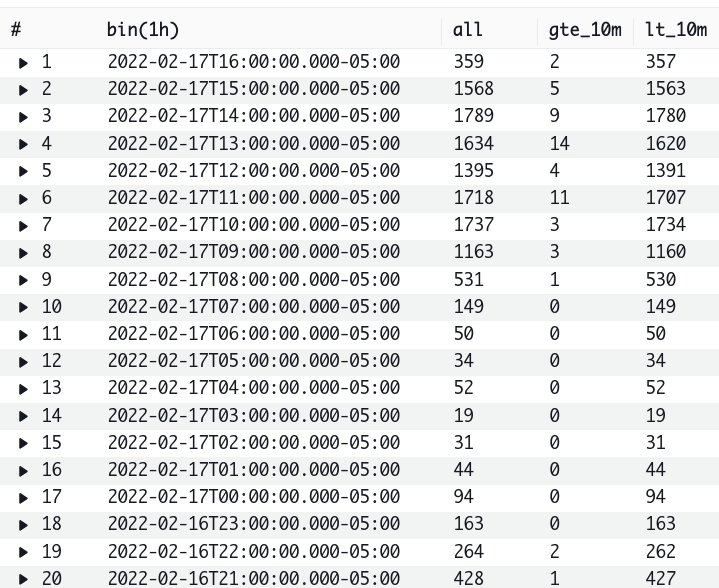
Below is a screencap of some data. Note the entry that took 9738.128 seconds.

Here’s the actual webhook request that we received:

{
	"timestamp": "2022-02-17 18:44:00,005",
	"level": "INFO",
	"location": "root.handler:83",
	"message": {
		"webhook_notification": {
			"event": "meeting.ended",
			"payload": {
				"account_id": "******************",
				"object": {
					"duration": 60,
					"start_time": "2022-02-17T15:01:24Z",
					"timezone": "America/New_York",
					"end_time": "2022-02-17T16:01:41Z",
					"topic": "Carbone-Kassl conversation",
					"id": "97454783663",
					"type": 2,
					"uuid": "",
					"host_id": ""
				}
			},
			"event_ts": 1645113701878
		}
	}
}

As I said above, I am unable to find an entry for this request in the call logs.

Which App Type (OAuth / Chatbot / JWT / Webhook)?
Webhook

Screenshots (If applicable)

Additional context
Add any other context about the problem here.

Ah-hah i found one! On my side this particular request clocked in at 2346 seconds difference between the event_ts and our webhook app’s log timestamp. I noticed the call log record includes a runTime value. In this case it was “6341”. What does that mean?

Are these extreme latency cases an expected behavior and something we just have to live with? Looking further at the data I’m seeing sometimes a dozen or more requests with a latency > 10 minutes.

Hi @jluker ,this is unexpected – can you please create a support ticket? https://devsupport.zoom.us/hc/en-us

Thank you!

Copying over content from the ticket for anyone searching for this issue in the future.

We are seeing a pattern of occasional high latency in our webook notifications, i.e. the time between the notification message’s event_ts value and our webhook endpoint log entries for the request. The problem appears to increase/decrease along with the the amount of activity in our zoom account. We are tracking several meeting events, including ‘meeting.started’, ‘meeting.ended’, ‘recording.complete’. For 99% of our webhook calls the latency seems find, but there are sometimes a dozen or more ouliers per hour (see upload #1) that can take more than 10 minutes. I’ve seen cases of > 90 minutes (upload #2).

I’ve started tracking the issue and upload #3 shows the past 3 days of metrics.

A related issue, mentioned in the original forum post, is that sometimes it seems like I can’t find a corresponding entry for these super high latency outliers when i look in our Zoom marketplace webhook call logs. After searching I did eventually find one. Could you tell me what the runTime value means in the context of those call logs? Also, how would one search for call logs for the full seven days they are kept? It’s not practical to use the web UI pagination to go back more than an hour or so.


Here are answeres to your question:

  1. There is no alternative way to view webhook call logs other than the marketplace web ui.
  2. The runTime value represent value is the execution time taken, it is the difference between the Response time and RequestInQueue time.

Here is the feedback we received from engineering for one of the meetings showing webhook latency:

"the meeting 97454783663 , ended at 2022-02-17 16:01:41 according to our monitor logs. We sent the meeting.ended webhook to this https://kifehpyvx2.execute-api.us-east-1.amazonaws.com/live/new_recording endpoint at 2022-02-17 16:01:59:915 . But the customer’s endpoint returned “ java.net.UnknownHostException:kifehpyvx2.execute-api.us-east-1.amazonaws.com: Name or service not known" error message then it triggered the retry policy, the second retry the endpoint returned Connection lease request time out after the third retry, we sent the webhook to the customer endpoint successfully. runTime value is the execution time taken, it is the difference between the Response time and RequestInQueue time.
The Webhook logs give the data of the most recent 100 logs within the last 7 days. Thank you!"


I think your engineering team is misreading the error messages. It is not our endpoint that is returning the UnknownHostException. That’s a DNS failure on your end. The hostname kifehpyvx2.execute-api.us-east-1.amazonaws.com is a public AWS Apigateway endpoint and should always be resolvable to one or more public IPs.

If I use dig I get:

; <<>> DiG 9.16.24-RH <<>> kifehpyvx2.execute-api.us-east-1.amazonaws.com
;; global options: +cmd
;; Got answer:
;; ->>HEADER<<- opcode: QUERY, status: NOERROR, id: 26411
;; flags: qr rd ra; QUERY: 1, ANSWER: 4, AUTHORITY: 0, ADDITIONAL: 1

;; OPT PSEUDOSECTION:
; EDNS: version: 0, flags:; udp: 65494
;; QUESTION SECTION:
;kifehpyvx2.execute-api.us-east-1.amazonaws.com.        IN A

;; ANSWER SECTION:
kifehpyvx2.execute-api.us-east-1.amazonaws.com. 60 IN A 13.249.184.87
kifehpyvx2.execute-api.us-east-1.amazonaws.com. 60 IN A 13.249.184.111
kifehpyvx2.execute-api.us-east-1.amazonaws.com. 60 IN A 13.249.184.80
kifehpyvx2.execute-api.us-east-1.amazonaws.com. 60 IN A 13.249.184.47

;; Query time: 17 msec
;; SERVER: 127.0.0.53#53(127.0.0.53)
;; WHEN: Wed Feb 23 08:07:31 EST 2022
;; MSG SIZE  rcvd: 139

The error from the 1st retry (2nd attempt), “Connection lease request time out”, comes from your Java http connection pool and indicates that the process attempting to make the request timed out while waiting for a connection pool thread to be available. I don’t know enough about your system to make informed suggestions beyond just increasing that thread pool size or adjusting the lease timeout.

Thank you @jluker for adding this here for other developers to see! We appreciate your contributions to the developer community. Also sharing this here:

This topic was automatically closed 30 days after the last reply. New replies are no longer allowed.